Annual International Conference on modeling urban water systems, Feb 21-22 2013 in Toronto - call for papers

Annual International Conference on modeling urban water systems, Feb 21-22 2013 in Toronto - call for papers

My note, this is a conference well worth attending, the Convenor is Dr Bill James and the venue is described at the CHIWater link shown below.

Once again it's the time to request one or more abstracts for the Annual International Conference on the Modeling of Urban Water Systems (formerly SWMM users meeting), to be held Feb 21-22 2013 in Toronto (note the venue). As you probably know, this is the 46th (!) meeting in this extraordinary series. This year our featured speakers include many well-known scientists, researchers and engineers (listed on our website).
The meeting is well attended: your audience exceeds 100 folks in your specialty. Also, the meeting is inexpensive, highly-regarded, professional, friendly and collaborative. Proceedings are produced as a peer-reviewed, integrated archival-quality book (you get the previous year's monograph at this conference, two-for-one value). The conference addresses all aspects of urban water systems, including planning, design, construction, operation, monitoring, models, safety, and security; how to manage urban water systems including water supply, drainage, pollution control, domestic, municipal, and industrial waters and stormwater from surface water catchments or ground water; and real-time control along with education, outreach, and practical applications. We welcome abstracts in any and all of the following general categories:; LIDs and BMPs; TMDLs; Urban water disasters, Urban flood management, Land Use; Nonpoint Sources of Pollution; Pavement; Pathogens; Stormwater and Urban drainage; Potable Water Supplies; Water distribution; Water System utilities; and other management and socio-political issues. Although the discussion is generally technical, it meshes well with management and difficult topics connected to urban water and related to computer modeling. Please visit:

http://www.chiwater.com/Training/Conferences/conferencetoronto.asp

Please email your 1-page abstract(s) to me in the next week or so. Alternatively, if you need a more formal invitation or a flyer, let me know.  We look forward to seeing you and your colleagues in Toronto - you won't get a better deal in these economically-challenged times!

Sultanate of Oman Selects InfoWorks WS Smart Water Modeling Software to Advance Country’s Water Network

Sultanate of Oman Selects InfoWorks WS Smart Water Modeling Software
to Advance Country’s Water Network

Key Middle East Utility Looks to Innovyze Technology 


Broomfield, Colorado USA, November 20, 2012 — Innovyze, a leading global innovator of wet infrastructure modeling and simulation software and technologies, today announced that Seureca Muscat, a subsidiary of Veolia Environment (NYSE: VE), in support of the Public Authority for Electricity and Water of the Sultanate of Oman has adopted InfoWorks WS smart water modeling software to improve the operation, maintenance and management of the country’s water utilities. With this purchase, PAEW gains access to the most advanced and comprehensive water distribution network modeling and management applications in the industry.

In November 2010, the United Nations Development Program (UNDP) listed Oman as the nation most improved during the preceding 40 years. Omani authorities and PAEW have long been focused on developing, enhancing and strengthening the Sultanate’s water infrastructure, working in partnership with Seureca Muscat (part of Veolia Water) to co-manage water services. PAEW supplies water to 50 percent of the citizens of Oman through a hydraulic network that includes a 132 MGD (500 million liter) drinking water network fed by 4 large 25+ MGD (100+ million liter) desalination works. The water network is rapidly developing and expanding with the ultimate aim of supplying the vast majority of the population from a water network by 2035.

“Innovyze has always had an outstanding reputation for innovation, technical support and customer service, but the most important factor in our decision was that InfoWorks WS software matched our needs,” said Richard Burd, Senior Engineer, Seureca Muscat. “We are now able to make determinations based on an accurate view of the network’s strengths and weaknesses. We can also better monitor the country’s water quality and utility operations to insure that we are delivering the best possible water and customer service.”

Around the world, high quality all-mains InfoWorks WS models are enabling utilities to make informed and confident planning, design and management decisions by giving them an accurate view of their drinking water distribution systems’ performance. This information — including water quality, supply, demand and infrastructure problems and investigations of remedial measures — allows them to provide commercial, industrial and domestic users with a sustainable supply of high quality water at an acceptable pressure and flow rate while minimizing loss through leakage. Part of the Innovyze advanced workgroup modeling management platform, InfoWorks WSis built to handle very large and complex models and allow robust multi-user collaboration.

Using an industry standard relational database, InfoWorks WS allows utilities to review, compare and actively manage current and historical model network versions. In addition to full details of each modification made to the network geometry and control data, the software also provides version IDs, date stamps and modeler details. A “data flags” feature shows origins of all source data, enhancing users’ confidence level in the quality of the model. A “compare” function allows two model versions or sets of control data to be compared and creates a detailed report outlining the differences. The data can even be applied to another network or control set to update changes. When new infrastructure is commissioned in a modeled area, this functionality enables users to update existing models rather than rebuild them, resulting in enormous productivity gains and financial benefits.

“We’re very pleased to know that one of the world’s most-improved countries has selected our industry-leading smart water software to help them better meet the many needs of their growing country and its citizens,” said Andrew Brown, Director of International Operations for Innovyze. “InfoWorks WS is a powerful solution that solves many of the analysis, design and business challenges that expanding utilities must face. We are delighted that PAEW has selected Innovyze in its continuous quest to strengthen water infrastructure and improve customer service in the Sultanate of Oman.”

Advanced Labeling in InfoSWMM or H2OMAP SWMM to show MM or IN on a HGL Plot

Advanced Labeling in InfoSWMM or H2OMAP SWMM to show MM or IN on a HGL Plot

Here is how to get the maximum depth shown in millimeters or inches on a HGL Plot in InfoSWMM or H2OMAP SWMM– use the OTHER LINK Dimensions option.  You need to run the model again to have your new diameter shown on the HGL plot.  We use the output file to make the HGL plot and without a new model run the maximum depth will not be shown in either InfoSWMM or H2OMAP SWMM. 

Keys:

Use Other Units instead of feet or meters, and

Use the Advanced Labeling in InfoSWMM or H2OMAP SWMM

How to Use Two Control Curves in SWMM 5 to Simulate a Head Difference Rule

Subject:  How to Use Two Control Curves in SWMM 5 to Simulate a Head Difference Rule

  The SWMM 5 control rules for Real Time Control (RTC) do not allow the rule to be governed by the head across the orifice but does allow rules based on the depth, head and inflow at any node.  If you have an Orifice in which you want the Orifice to be open when the head difference across the Orifice is either less than or greater than zero then and closed when the head difference is close to zero then you can use two Orifices (Figure 1) and two rules (Figure 2) to control the orifice setting for Orifice1 and Orifice2.  In attached file the two rules have the settings set to two control curves.  Orifice1 will start open and close gradually as the depth at Node UPNode increases, Orifice2 will start closed and gradually open when depth in Node DNode increases.  Possible variations are to control Orifice1 based on the DNode and node UPNode to control Orifice2.

  RULE Orifice1

IF  NODE UPNode  Depth >= 0 

THEN ORIFICE ORIFICE1 SETTING = Curve RuleOrf1

PRIORITY 10

 RULE Orifice2

IF  NODE DNode  Depth >= 0

THEN ORIFICE ORIFICE2 SETTING = Curve RuleOrf2

PRIORITY 10


Figure 1.  Two Orifice Solution


Figure 2. Two Orifice solution to have control over the Orifice(s) at both the upstream and downstream nodes. 


NASA computed Maps of Earth

NASA computed Maps of Earth

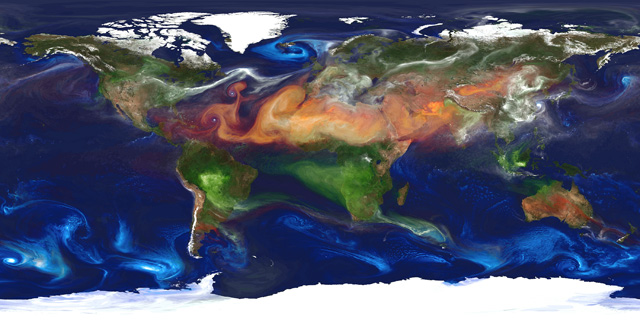
Die NASA hat sich ‘nen neuen Supercomputer angeschafft und simuliert mit dem die Erde, heraus kommen zum Beispiel so schicke Karten wie das Ding oben, und das Teil ist keinFoto, sondern ‘ne berechnete Grafik. Whoa!

This is not a photo of the Earth from some far-flung satellite. This is the output of a computer that has been programmed to take those laws of physics and apply them to the Earth. It has data about sunlight hitting the Earth (which includes variations for season); it knows about the composition of the Earth’s atmosphere and how the air’s temperature changes with latitude, longitude, and height; it can calculate how much water evaporates and where it rains or snows out; it accounts for fires, dust, the Earth’s rotation, the local geography, and even humanity’s effect on the environment.

And when it’s done, it can show us what the Earth looks like under various conditions. In this case, the blue swirls over the oceans trace sea salt; green is smoke from forest fires, white is sulfate particles (emitted from volcanoes and the burning of fossil fuels), and reddish-orange is dust blown about.  Slate Link

Planet in a Bottle: NASA creates computer model of dust storms, forest fires, and sea salt.